

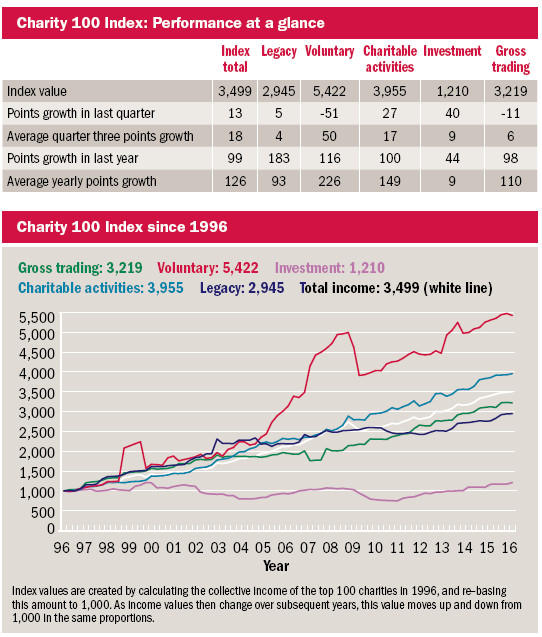
The biennial nature of Comic Relief’s major fundraising events can have a big impact on quarter three results in the haysmacintyre / Charity Finance Charity 100 Index, and this time round is no exception. Overall income at the top 100 charities fell short of its average quarterly rise by 5 points in the third quarter of 2016.
This is in large part because Comic Relief saw a 20 per cent fall in total income to £92.2m in the year to 31 July 2016. But this fall is primarily because it organises two fundraising events which take place in alternate years: Sports Relief, which raised £72.5m in 2016, and the more established Red Nose Day, which raised £99.4m in 2015.
As there is a substantial difference between the fundraising power of the two, comparisons between alternate years are probably a more meaningful guide to performance than straightforward year-on-year comparisons. Sports Relief 2016 raised slightly more than the £71.8m raised by Sports Relief 2014 and this, along with other increases in fundraising, investment and trading income, contributed to a 9 per cent increase in total income between 2013/14 and 2015/16.
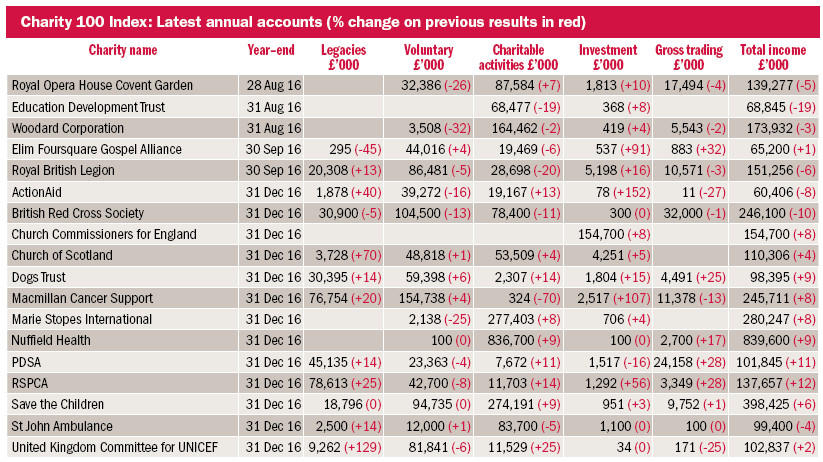
Looking at individual income streams in the Charity 100 Index, the worst performing was voluntary income, which missed its quarterly benchmark by 101 points. This was largely as a result of chunky 20 per cent-plus falls in voluntary income reported not only by Comic Relief but also the Royal Opera House Covent Garden (where reasons for the fall were not given in the accounts).
Trading income missed its quarterly benchmark too, though by a smaller margin of 17 points, due largely to a 37 per cent fall in this income stream reported by Comic Relief.
Subpar performance from voluntary and trading income cancelled out the above average rises in income from investment, charitable activities and legacies, which outperformed their quarterly benchmarks by 31, 10 and 1 point respectively.
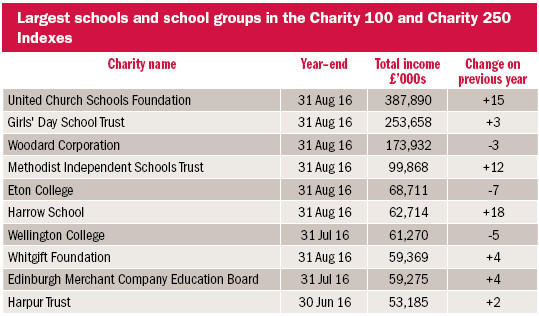
On the positive side, strong performance was reported by the United Church Schools Foundation, which posted a 15 per cent increase in income to £387.9m, off the back of a 16 per cent increase in income from charitable activities. This was because in the year to 31 August 2016, the education charity acquired one new independent school and two new academies, bringing the total number of independent schools managed by the group up to 13 and the total number of academies up to 43. The acquisitions resulted in a transfer of net assets of £22.9m and increased funding from the Department for Education.
Strong schools representation
Schools are the most well represented sector in the Charity 100 and Charity 250 Indexes and account for 18 per cent of the 350 member charities. They also account for two-thirds of charities reporting their results in the third quarter, making a review of the sector’s performance timely.
Schools included in the Indexes range from the large school groups in the Charity 100 Index such as the aforementioned United Church Schools Foundation and the Girls’ Day School Trust (GDST), with annual income of £387.9m and £253.6m respectively, to individual schools in the Charity 250 Index with annual income of £22.2m and above. Most of the schools represented in the Indexes are independent schools, as academies are not eligible for inclusion. There are, however, some mixed groups such as United Church Schools Foundation and GDST, which manage both independent schools and academies.
As a group, the schools represented in the Charity 100 and Charity 250 Indexes have performed reasonably well with over 80 per cent reporting increased income. The biggest rise, reported by Stowe School, was 25 per cent, resulting from an unexplained 15 per cent increase in school fee income and a near quadrupling of voluntary income donated by the Stowe School Foundation.
The biggest fall, reported by Eton College, was 7 per cent, due to a 44 per cent decrease in investment income. It put this down to an exceptional year in 2015.
The median annual change for the group as a whole is a 4 per cent increase, down slightly from 5 per cent last year.
Concerns about the affordability of fees that emerged after the 2008 financial crisis have led many schools to keep a cap on fees by controlling costs and tapping other income streams such as fundraising, trading or investment. For schools that cannot readily tap other income sources, however, the cap on fees effectively limits the scope for income growth.
Recent research from haysmacintyre shows that average fee increases at independent schools fell to 3.2 per cent in 2016/17, representing “the lowest average increase over the last 16 years … lower than the increase applied in the year following the 2008 financial crisis, which was 3.5 per cent.”
Public benefit test
A key issue for the independent schools sector over the last few years is the requirement to demonstrate public benefit, which has given rise to robust discussions involving the Charity Commission and the Independent Schools Council (ISC) over the application of the rules. Independent schools have undoubtedly made great progress in meeting public benefit disclosure requirements, though arguably there is more that they can do to structure the process and embed public benefit reporting in their accounts rather than presenting it as a perfunctory add-on (see box below).
The independent schools sector as a whole is regularly called upon to defend its charitable status. This has certainly been the case earlier this year, when the tax advantages enjoyed by independent schools came under fire from both sides of the house. Commenting in The Times, conservative MP Michael Gove argued that “removing the tax advantages of private schools would boost standards in the state sector and raise vital extra funds.” Later in the year, in the run up to the general election, the Labour Party manifesto pledged to fund free school meals for all primary school children by removing the VAT exemption on private school fees.
The ISC has roundly defended the sector, pointing out that the £150m that charitable status is estimated to be worth to independent schools is more than matched by the £380m in free and subsidised places that independent schools provide to children from low-income homes.
Moreover, it positions independent schools as part of the national education system, working in partnership – rather than competing – with state schools. The ISC’s 2017 Annual Census showed that 88 per cent of independent schools have voluntary partnerships with state schools that benefit an estimated 175,000 state school pupils.
“Ten thousand different partnerships now exist with state schools,” says ISC general secretary Julie Robinson. “They vary from academy sponsorship to seconding teaching staff, serving as governors at state schools and sharing facilities to partnering for activities and projects.”
A model of good practice cited by the ISC is Latymer Upper School in Hammersmith, which according to head David Goodhew, works with over 50 different state schools. “Our students and staff find it hugely rewarding, while our partner schools benefit from invaluable assistance with academic subjects, sport, music, professional development and governance.”
Read Richard Weaver's article on how independent schools should report public benefit.